Does Bitcoin’s Falling Wedge Mean Higher Prices?
Bitcoin’s (BTC, Tech/Adoption Grade “A-”) price has been building a falling wedge — a chart pattern that forms when the market makes lower lows and lower highs with a contracting range, creating a wedge shape — for the past seven days.
This pattern is considered to be bullish since it usually breaks upward.
You can see it clearly in Bitcoin’s four-hour TradingView chart here:
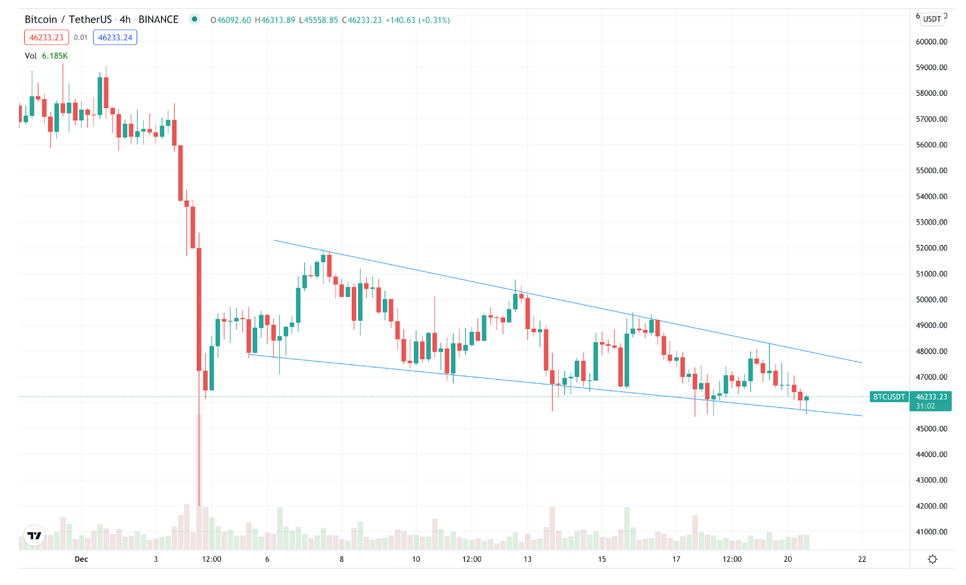
But an upside breakout needs a higher volume than what we’re seeing right now for BTC. In fact, the few other bullish reversal patterns that have shown up recently had no momentum and were invalidated.
That could be interpreted as a sign of weakness in the current market. Hence, there’s a possibility that this bullish wedge pattern may show weakness as well ... or that we’ll have to wait for volume to return before any bullish moves are made.
However, Bitcoin’s open interest — the total number of futures contracts held by market participants at the end of the trading day — rose rapidly in the past few days. It’s now at the highest levels since BTC took a plunge on Dec. 4.
Overall interest in BTC is apparent.
However, traders seem undecided on which way the market will go, with the percentage of short and long positions currently split 50/50. But some are hoping that increased interest will build into a short squeeze soon, which could push the price up.
On the other hand, some downside action could prove bullish as well. Over the past week, BTC has been trading more or less steadily with support at $45,000. If that level is broken down, the $42,000 area can be tested again ... and it would be bullish to see a possible double bottom formed in this scenario!
Moving away from BTC, in the ETH/USDT daily TradingView chart below, we can see Ethereum (ETH, Tech/Adoption Grade “A”) continuing to mirror its movements from the second half of September. Trading then and now is highlighted in the red ovals below.
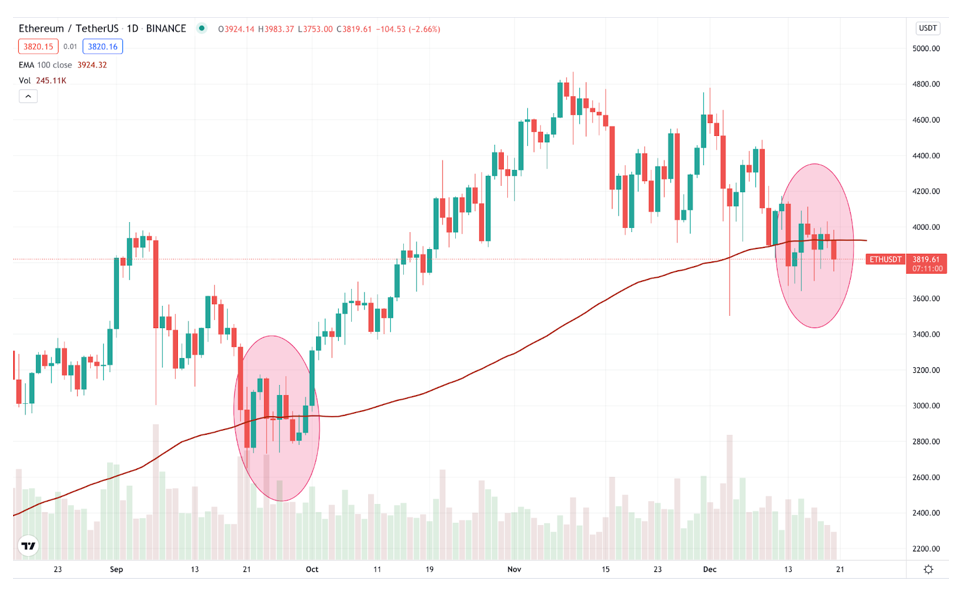
ETH is trading below its 100-day exponential moving average (EMA100). But that could change should it continue to follow in September’s footsteps and rally.
Meanwhile, the majority of altcoins have taken a serious hit.
One of just a handful of strong alts holding their own is Terra (LUNA, Tech/Adoption Grade “C-”), which hit a new all-time-high price of $81 just a few hours ago!
Notable News, Notes and Tweets:
- JPMorgan developed a blockchain system for Siemens’ payments.
- The Dubai World Trade Centre has plans to set up a specialized crypto zone.
- The Bank of England will push for tighter rules as institutions embrace crypto.
What’s Next
We’ve obviously been in the so-called markdown phase for the past couple of weeks. This means that whales have been cashing out, most probably for tax reasons. That’s what a lot of U.S. crypto traders do … they sell at the end of the year and buy at the beginning of the next.
But, as I said two weeks ago, BTC is likely going to trade sideways within the $42,000 to $52,000 range for weeks ... or even months.
The breaking of either of these two levels will be the important event to watch for. In the meantime, everything that’s happening within the range ... is almost boring.
Wait for the breakout of this range!
Best,
Marija Matić